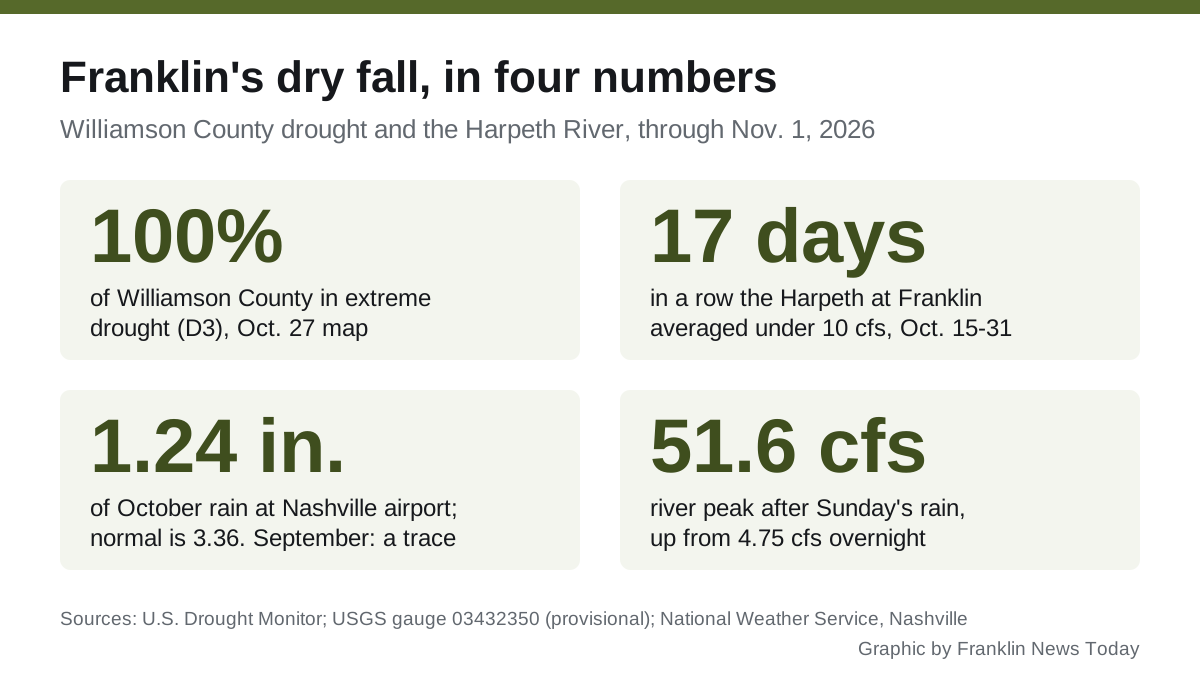
Extreme drought now covers about 10% of Williamson County, down from 100% a week earlier, after the Nov. 4 storms. The whole county is still in severe drought.
Updated Nov. 13: the Drought Monitor map dated Nov. 10, the first to count the Nov. 4 storms, cuts the share of Williamson County in extreme drought from 100% to 9.94%. All of the county is still in severe drought, one step down. Details below.
All of Williamson County was in extreme drought, the second-worst category on the federal drought scale, by late October. The U.S. Drought Monitor map for Oct. 27 put 100% of the county in that category, known as D3.
The Harpeth River shows it. The river’s daily average flow at Franklin stayed below 10 cubic feet per second every day from Oct. 15 through Oct. 31, 17 days in a row, U.S. Geological Survey gauge readings show. That is the level below which the city may not take water from the river under the state permit it announced in 2015.
Rain on Sunday lifted the river for the first time in weeks. More is in the forecast for Tuesday night and Wednesday.
How fast the drought arrived
Eight weeks ago Franklin was not in drought at all. The Drought Monitor’s county figures show how quickly that changed:
| Map date | Share of Williamson County in drought (D1 or worse) | Share in extreme drought (D3) |
|---|---|---|
| Sept. 1 | 0% | 0% |
| Sept. 15 | 16.95% | 0% |
| Sept. 29 | 100% | 0% |
| Oct. 13 | 100% | 6.86% |
| Oct. 20 | 100% | 15.77% |
| Oct. 27 | 100% | 100% |
| Nov. 3 | 100% | 100% |
| Nov. 10 | 100% | 9.94% |
On Sept. 1, about 22% of the county was rated only “abnormally dry,” the step before drought. The figures come from the Drought Monitor’s county statistics, which the National Drought Mitigation Center at the University of Nebraska-Lincoln publishes each Thursday with federal partners.
The rain that did not come
The nearest long-running National Weather Service station is at Nashville International Airport, about 17 miles northeast. Its monthly summaries show:
- September: a trace of rain, with no day reaching a hundredth of an inch. Normal is 3.80 inches.
- October: 1.24 inches over three days. Normal is 3.36 inches.
- Since Jan. 1: 29.58 inches, 12.75 inches below normal.
Those figures are from the weather service’s September and October climate summaries for Nashville and its daily summary for Sunday, Nov. 1, which recorded 0.46 inches.
What the river did
The USGS gauge on the Harpeth at Franklin has recorded flow since 1975. On Oct. 31 it averaged 5.42 cubic feet per second (cfs). The middle value for that date across those years is 25 cfs, so the river ran at about a fifth of its usual late-October flow, USGS daily statistics show.
It was not the lowest on record. The gauge’s lowest reading for Oct. 31 is 0.62 cfs, in 1981.
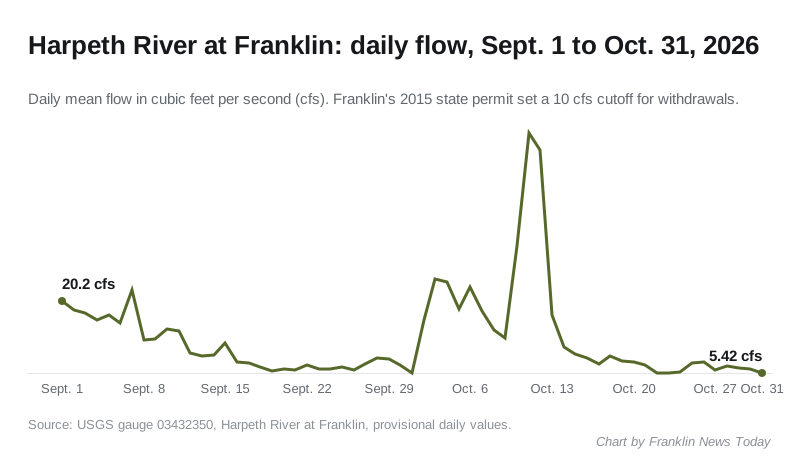
Key points from the gauge record:
- The river averaged 20.2 cfs on Sept. 1 and first dropped below 10 cfs on Sept. 12.
- Rain in early October pushed it to 54.7 cfs on Oct. 11. By Oct. 15 it was back under 10 cfs.
- The lowest daily average in October was 5.32 cfs, on Oct. 23.
- A second USGS gauge upstream, at river mile 90.5 near Franklin, ran lower still. It averaged under 10 cfs on 23 of October’s 31 days, its readings show.
Sunday’s rain changed the picture for a few hours. At Franklin the river rose from 4.75 cfs overnight to a peak of 51.6 cfs at 2:15 p.m. Sunday and was still at 44.5 cfs that evening. The upstream gauge peaked at 16.5 cfs. All figures are provisional and may be revised by the USGS.
Why 10 cfs matters
Franklin draws part of its drinking water from the Harpeth. When the city announced its five-year state withdrawal permit in July 2015, it said the permit caps withdrawals at a share of the river’s flow and stops them entirely when flow falls below 10 cfs.
Franklin’s city website could not be reached Monday, so we could not confirm the terms of the permit in force now, or read any current notice from the city’s Water Management Department. We will update this page when we can.
What comes next
The weather service forecast for Franklin calls for showers and thunderstorms likely Tuesday night, a 70% chance, and showers and thunderstorms Wednesday, a 90% chance, according to the National Weather Service in Nashville. Drier weather is forecast for Thursday and Friday.
One or two rainy days rarely end a drought of this depth. Sunday’s rise at the Franklin gauge began to fall within hours.
Wednesday’s storms
The Nov. 3 Drought Monitor map left the county unchanged, with 100% in extreme drought, the county statistics show. Each weekly map counts rain only up to the Tuesday morning it is dated, so it does not count Wednesday’s rain.
That rain reached the river fast. Provisional readings from the USGS gauge at Franklin show:
- 4.58 cfs daily average on Tuesday, Nov. 3
- 3.05 cfs at midnight Wednesday
- a peak of 1,390 cfs at 8:45 p.m. Wednesday
- 615 cfs daily average on Wednesday, Nov. 4
- 313 cfs at 6:15 p.m. Thursday, still falling
A single high-water day does not refill soil and groundwater.
The Nov. 10 map
The Drought Monitor map dated Nov. 10 is the first to count the Nov. 4 storms. It moved most of Williamson County out of extreme drought. The county statistics show:
- Extreme drought (D3): 9.94% of the county, down from 100% on the Nov. 3 map
- Severe drought (D2) or worse: still 100% of the county
- Exceptional drought (D4), the worst category: none
So the drought is less intense, not over. Every part of the county is still rated in severe drought.
The river readings since the storms are less clear. Provisional figures from the Franklin gauge show the Harpeth falling back below 10 cfs from Nov. 8. They do not match the upstream gauge at river mile 90.5, which averaged 32.5 cfs on Nov. 12. A gauge downstream normally carries more water than one upstream, so we are not reporting the Franklin figures until the USGS has reviewed them. The next Drought Monitor map, dated Nov. 17, is due Thursday, Nov. 19.
What it means for you
- Water customers: check the City of Franklin Water Management Department page or call City Hall for any conservation request or watering limits before you irrigate. Our who to call at City Hall page has the numbers.
- Outdoor burning: the Tennessee Division of Forestry requires a burn permit from Oct. 15 to May 15 and pauses permits when fire risk is high. Check BurnSafe TN before burning leaves or brush.
- Watch the river yourself: the USGS gauge page updates every 15 minutes and shows whether this week’s rain holds the river above 10 cfs or lets it slide back.
Rainfall figures are for Nashville International Airport, the nearest official long-term weather station. River figures are provisional USGS data.
Have your say